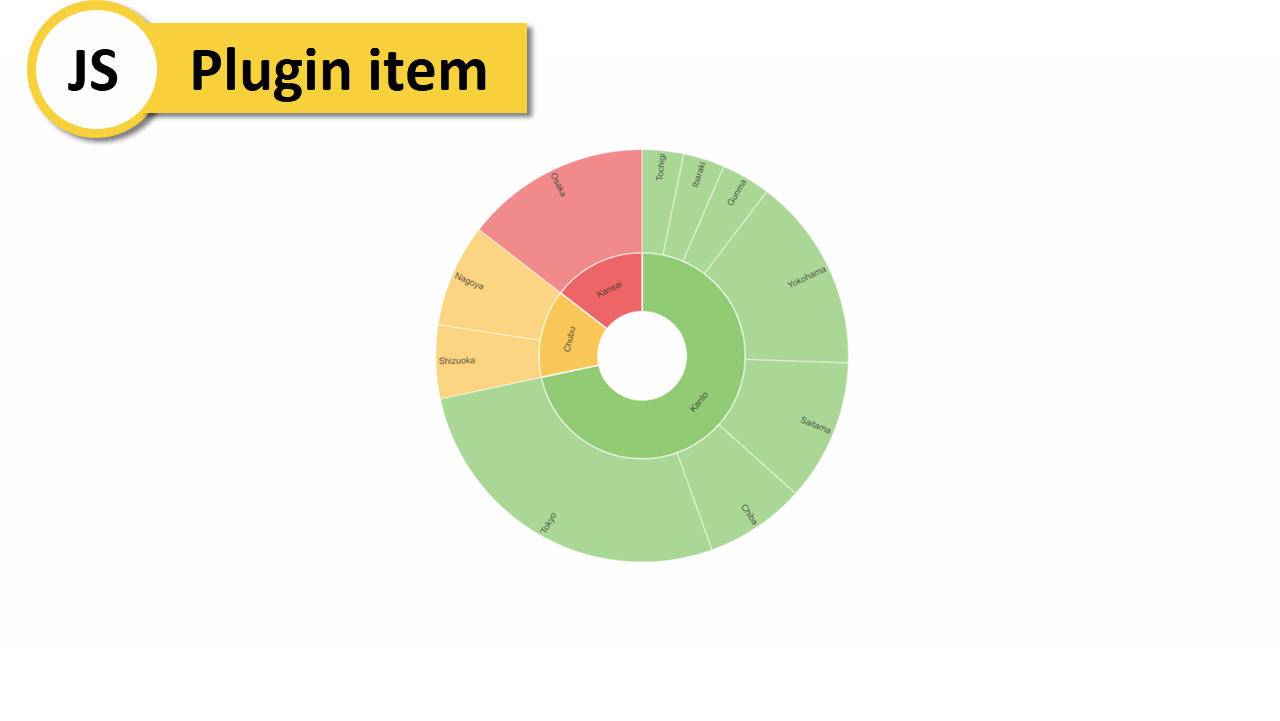
Two-tiered pie chart
If you have multiple classified items such as food and meat, and numerical data such as sales, you can view the breakdown at different granularities. In the sample script, you can also highlight the data by moving the mouse over the target area. This allows for an intuitive view of the sales status of specific products, from the product categories with the largest sales to the specific product sales status.
※样例的下载方法
Plug-in item is required for this sample. You cannot use it with MotionBoard Cloud.
The plug-in items provided in the Sample Gallery are not subject to ISMAP and SOC1 information security certifications. Please refer to the following page for information security certifications obtained for MotionBoard Cloud.
https://corp.wingarc.com/security_governance/certification.html
适用产品:MotionBoard
版本号:Ver. 6.2 or later. The latest patch must be applied.
客户正使用中的产品样例
样例支持语言: 英语
上传日期:2022/12/22
更新日期:2024/08/13

