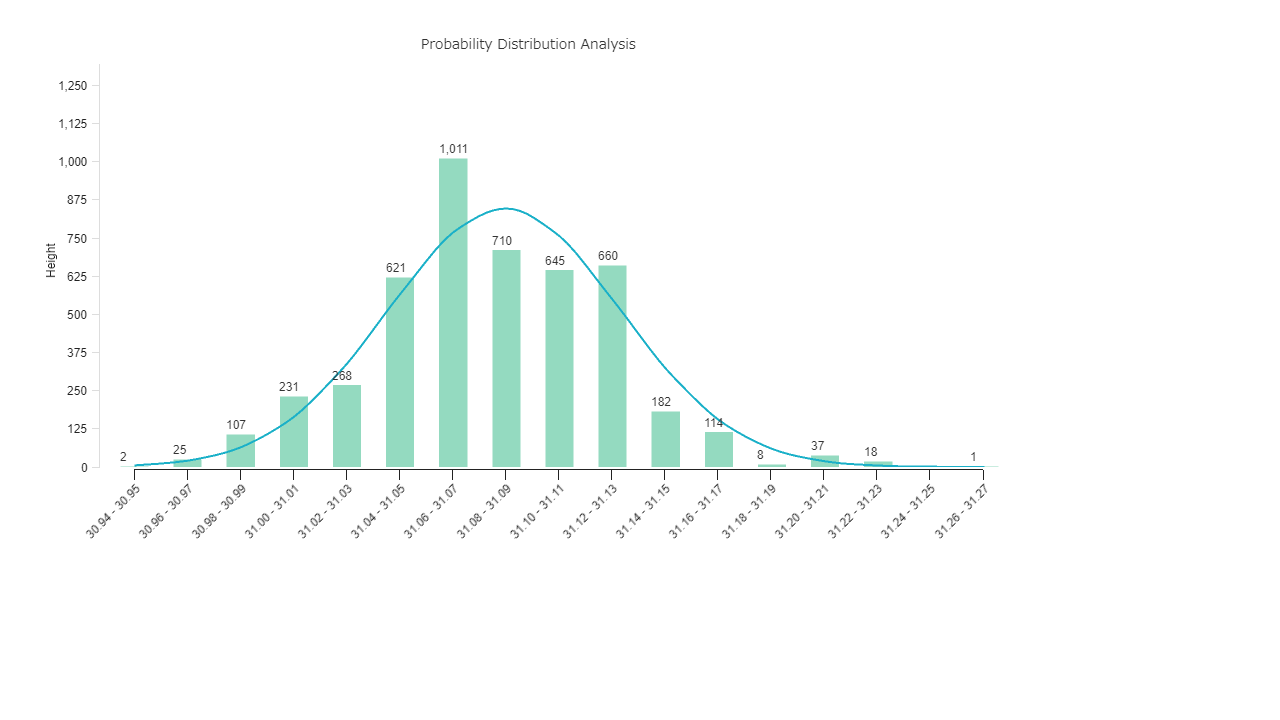
Probability distribution analysis
This sample is used for probability distribution analysis. Probability distribution analysis is a function that groups numerical data within a certain range to understand and analyze the variability of the data.
As you see in the sample, the distribution situation is represented as a histogram. The histogram can also display a normal distribution curve, so you can visually visually whether the data follows a normal distribution.
适用产品:MotionBoard、MotionBoard Cloud
版本号:Ver. 6.0 or later. The latest patch must be applied.
客户正使用中的产品样例
文件下载
样例支持语言: 英语
上传日期:2023/02/20
更新日期:2023/02/20

