Functions
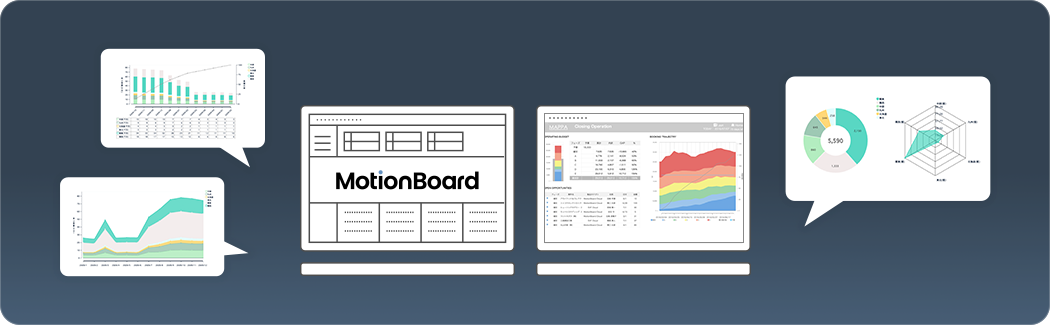
MotionBoard is a data app platform that provides
all the essential functions for data utilization
in a single tool.
Explore the details of each function below.
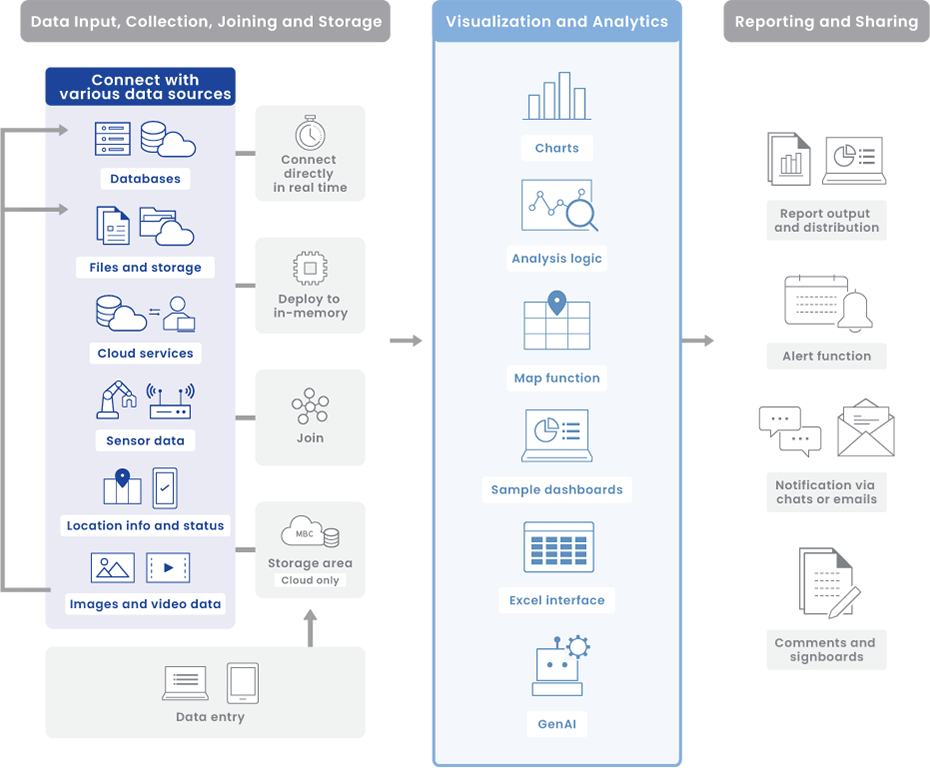
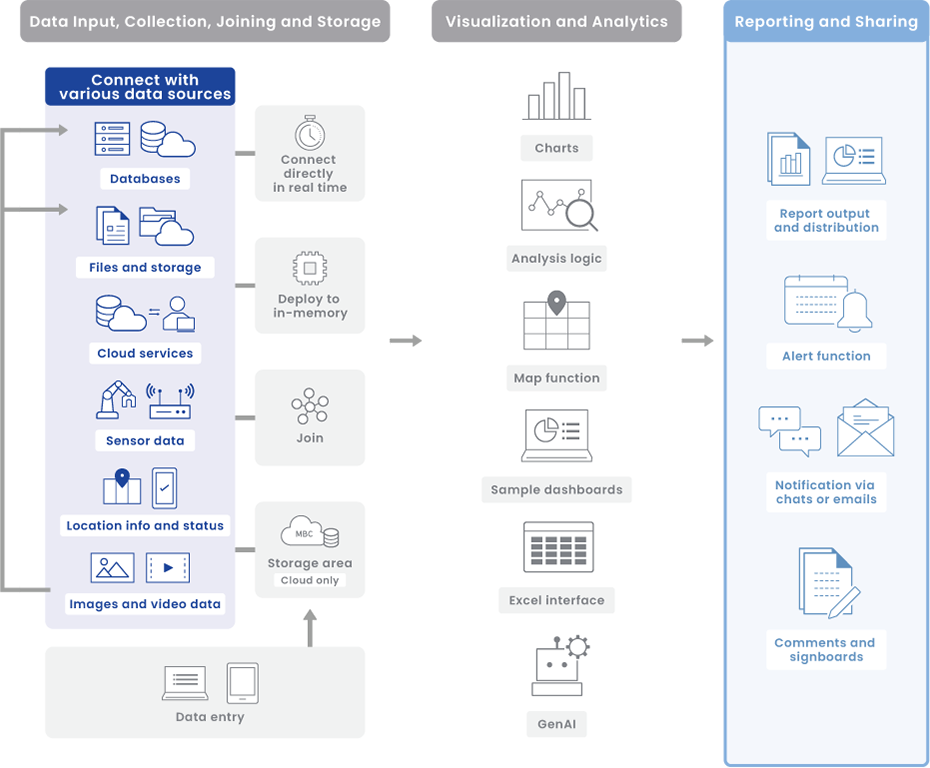
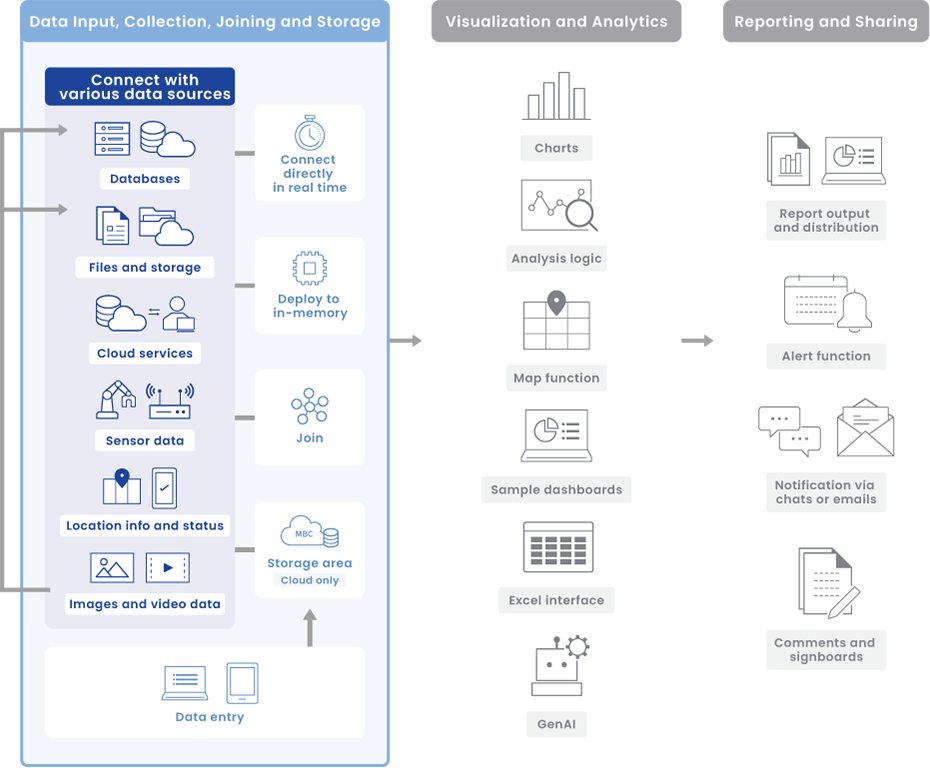
Visualization and Analytics
With MotionBoard, analytics is close at hand, deriving insights from data.
You can immediately execute what you want to do with intuitive operations.
Explore useful Visualization and
Analytics functions
Feature 01
Rich charts and
analytic logic
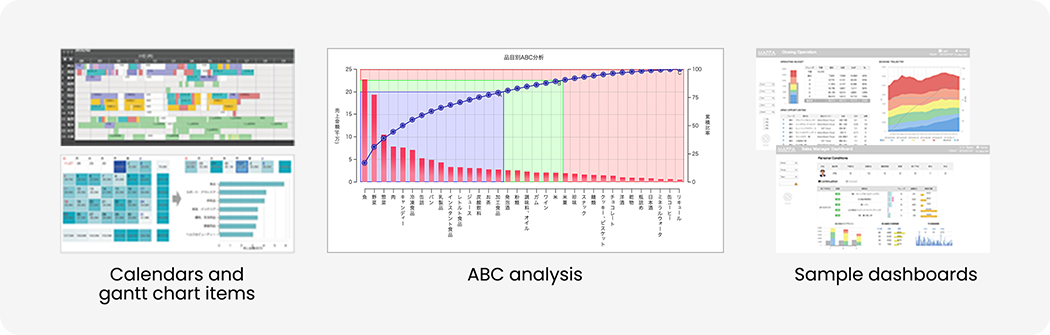
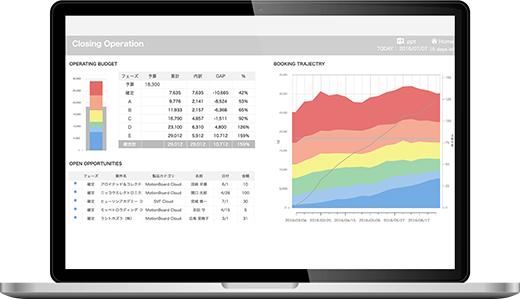
In addition to familiar basic charts and tables, MotionBoard offers a rich variety of visualizations,
including Pareto charts, heat maps, scatter plots, radar charts, and waterfall charts.
It also offers a wealth of analytical logic to enable advanced analysis without programming.
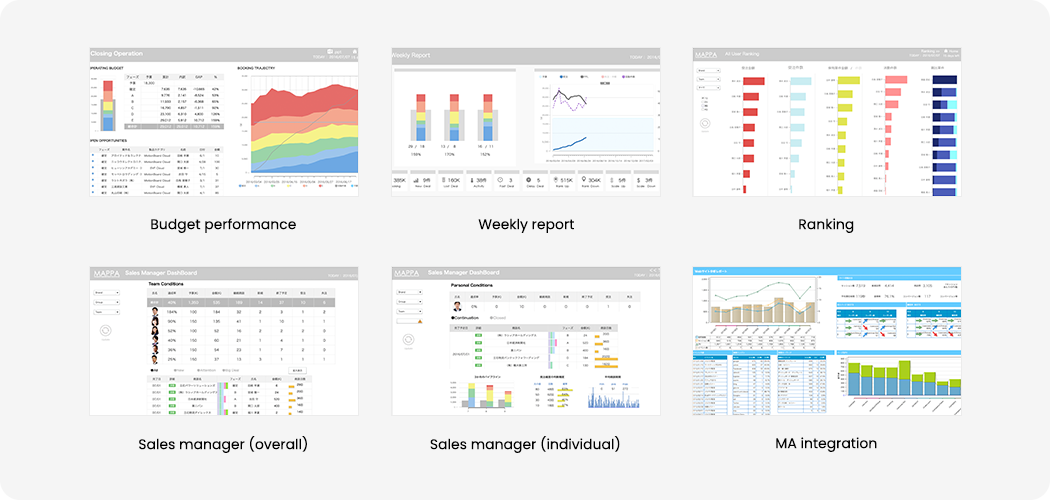
We offer an extensive range of ready-to-use templates tailored to the needs of various industries and business roles.
These templates are packed with visualization expertise, ensuring that data is not just viewed, but transformed into clear insights that drive the next action.
Feature 02
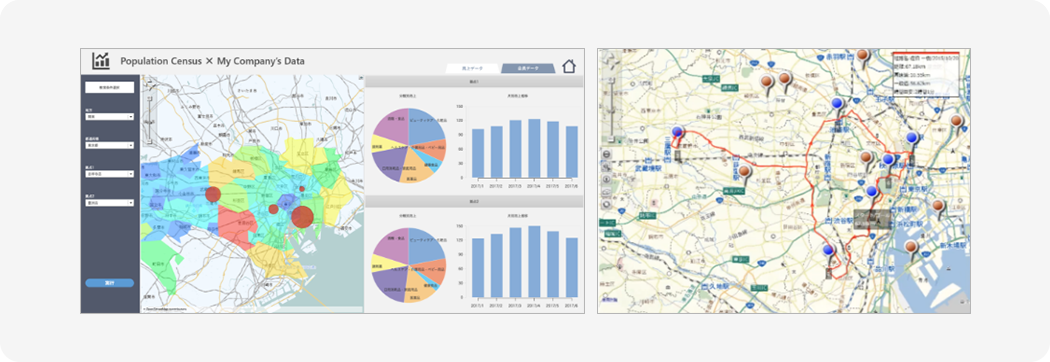
Map function
MotionBoard comes standard with map functionality, allowing the use of high-precision commercial maps: MapFan, Mapion, ESRI (ArcGIS).
Usage examples
- Visualizing trends by region
- Area marketing such as market analysis
- Plotting location and travel data on maps
- Visualizing trade areas and efficient route plans
Feature 03
A wide variety of sample dashboards
We offer templates tailored to the needs of various industries and business roles.
These templates are packed with visualization expertise, ensuring that data is transformed into clear insights that drive the next action.
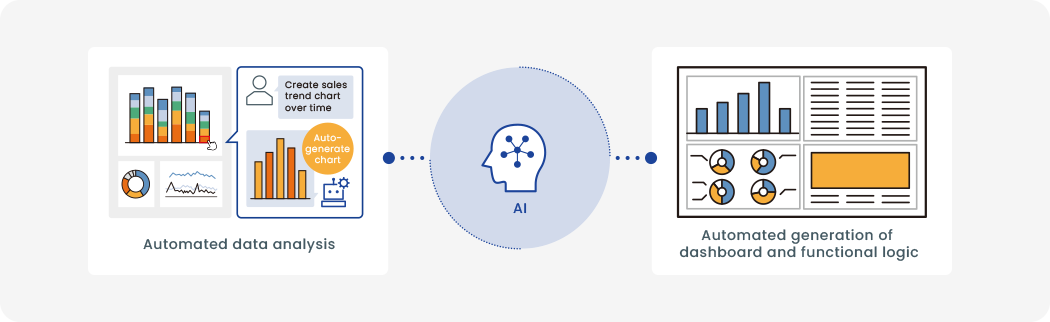
Feature 04
Generative AI integration
With generative AI integration, it is possible to automatically generate dashboards and charts and design operations using natural language, making visualization easy for anyone.
Additionally, it allows for more free and flexible data utilization, such as performing insight analysis from data and reading images or videos.
Reporting and Sharing
It is possible to automatically execute report creation and distribution, as well as detecting changes.
This improves productivity and conveys the value of data throughout the organization.
Explore the functions useful for
Reporting and Sharing
Feature 01
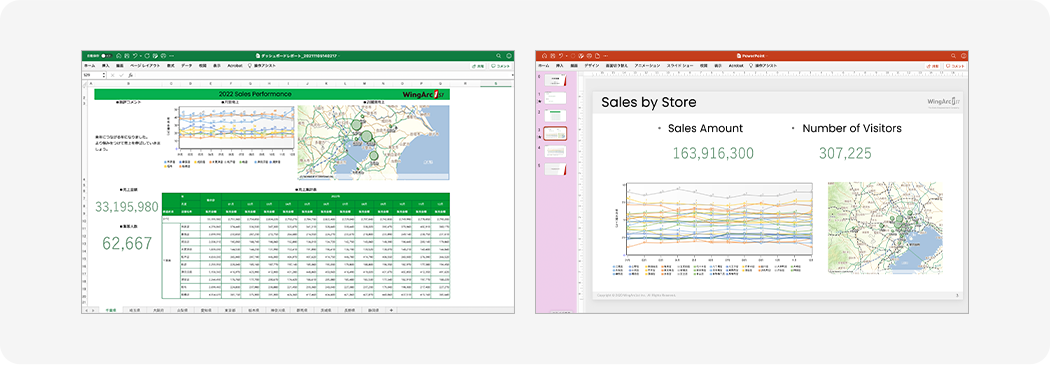
Report output and distribution Optional
Items on the dashboard can be output to Excel and PowerPoint, and distributed.
Automate daily report creation and distribution tasks, and use it as a foundation for business reporting tasks.
Feature 02
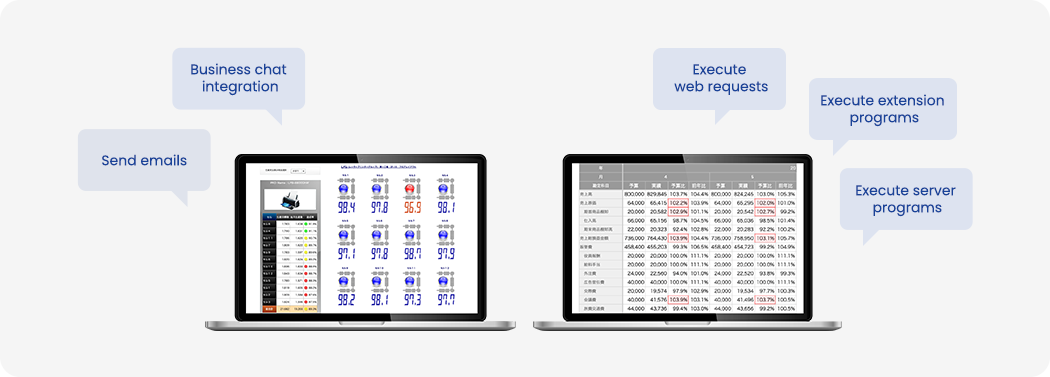
Alert function
MotionBoard monitors status based on pre-set thresholds.
It can instantly detect changes in sensor data and large amounts of business-generated data.
Additionally, it is possible to automatically execute processes such as notifications and program execution when alerts are triggered.
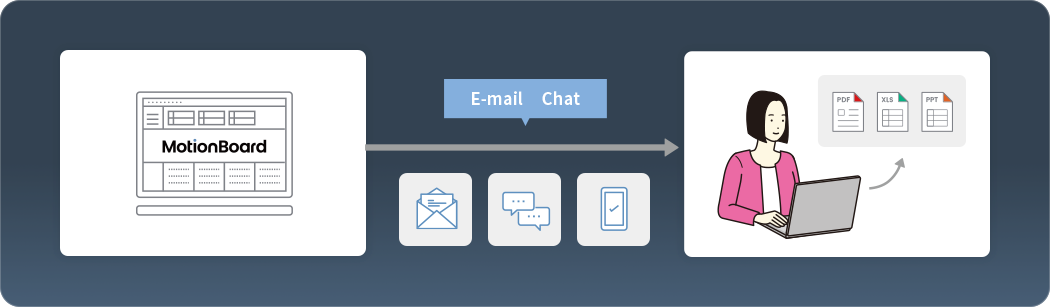
Feature 03
Chat integration
You can capture the dashboard and send the output reports via chat or email.
Furthermore, if integrated with generative AI *, you can receive data analysis results in natural language from your chat tool.
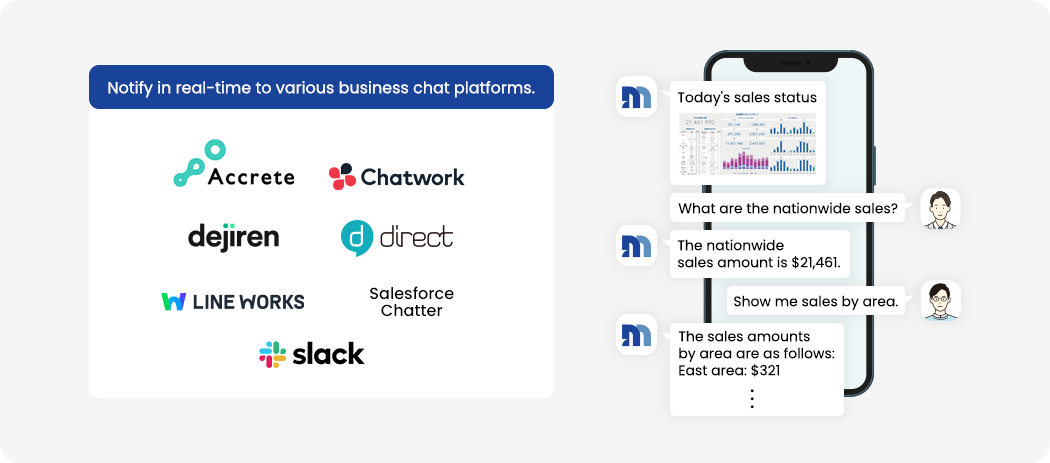
- *To use the chat tools integrated with generative AI, a separate subscription to the product "dejiren" is required. Please contact us for details.
Feature 04
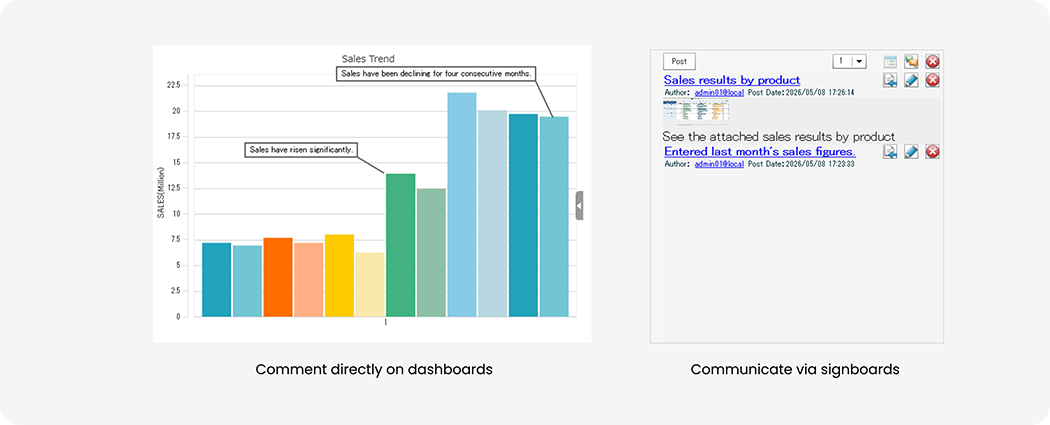
Comments and
signboards
You can add comments to the dashboard, allowing you to share insights and instructions from the analysis results in a specific manner.
Additionally, it is possible to share related information and communicate on the signboard.
Data Collection, Joining and Storage
Real-time integration with various data sources. Input data like a business app.
MotionBoard provides comprehensive functions to aggregate data scattered across the company.
Explore the functions useful for
Data Collection, Joining and Storage
Feature 01
Extensive data
source connectors
You can connect to over 60 types of data source.
By aggregating the data necessary for analysis, decision-making, and business execution on the dashboard, MotionBoard improves the speed and accuracy of business operations.


Expanding the supported data sources via CData Software adapters.
Starting from version 6.3, it is now possible to connect cameras, allowing for the analysis of actions that cannot be quantified and enabling remote site supervision.
- Usage example in the manufacturing industry
-
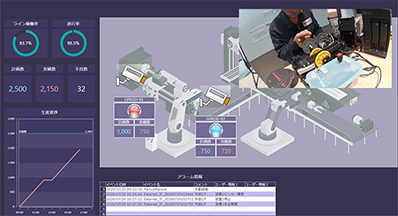
Analyzing equipment downtime and worker productivity loss
- Usage example in the construction industry
-
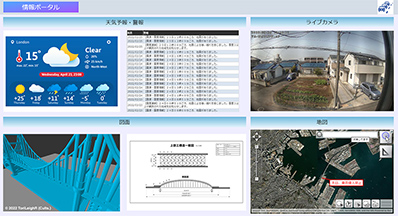
Understanding the situation of a large site remotely
- For details regarding camera connection, please refer to "System Requirements "
or contact us.
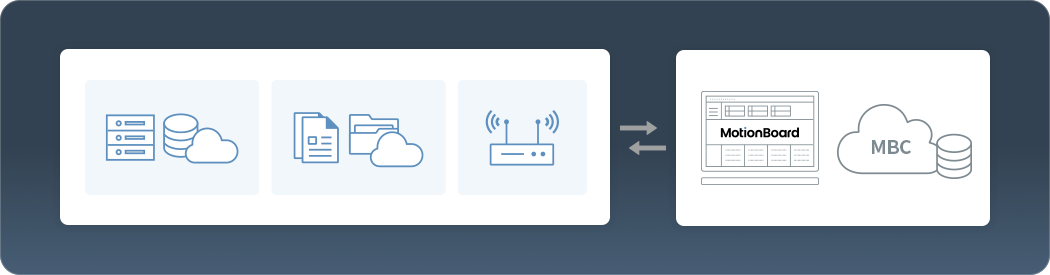
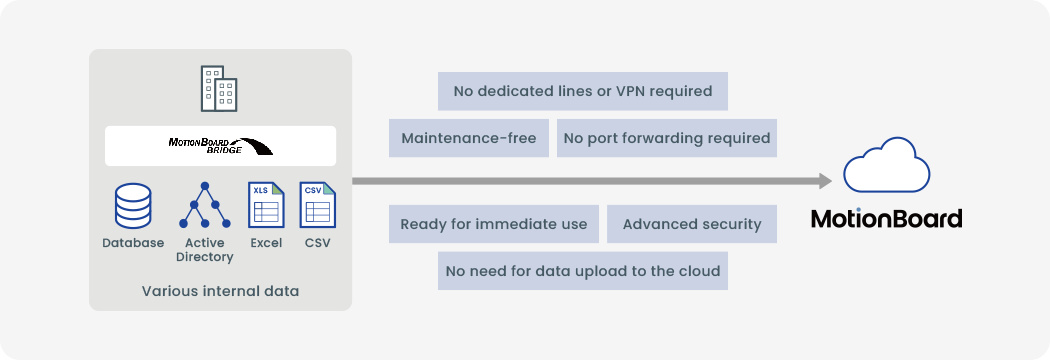
Secure data integration beyond network environments
The MotionBoard Bridge Service ensures secure communications between different networks.
Connect your internal network data directly to MotionBoard Cloud.
Feature 02
Flexible data aggregation methods
MotionBoard offers two aggregation methods, which you can choose according to your requirements.
Feature 03
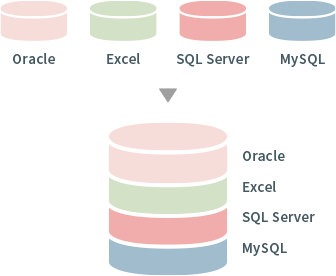
Data join capabilities
You can join multiple data sources and treat them as a single data source.
Even if data is scattered across different systems, databases, and files, it can be integrated and analyzed using MotionBoard.
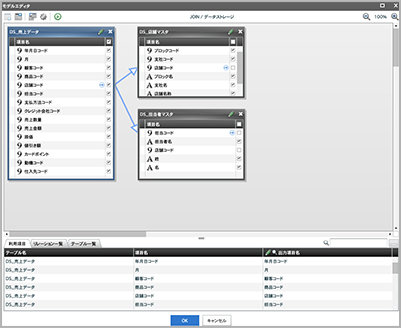
Design views with simple mouse operations
Supports JOIN and UNION operations
Feature 04
Various data input methods
MotionBoard supports various data input methods, allowing you to input primary business data on the spot. This data can be immediately utilized for visualization and analysis.
Since MotionBoard itself has input functions, you can input and update data directly from the dashboard screen.
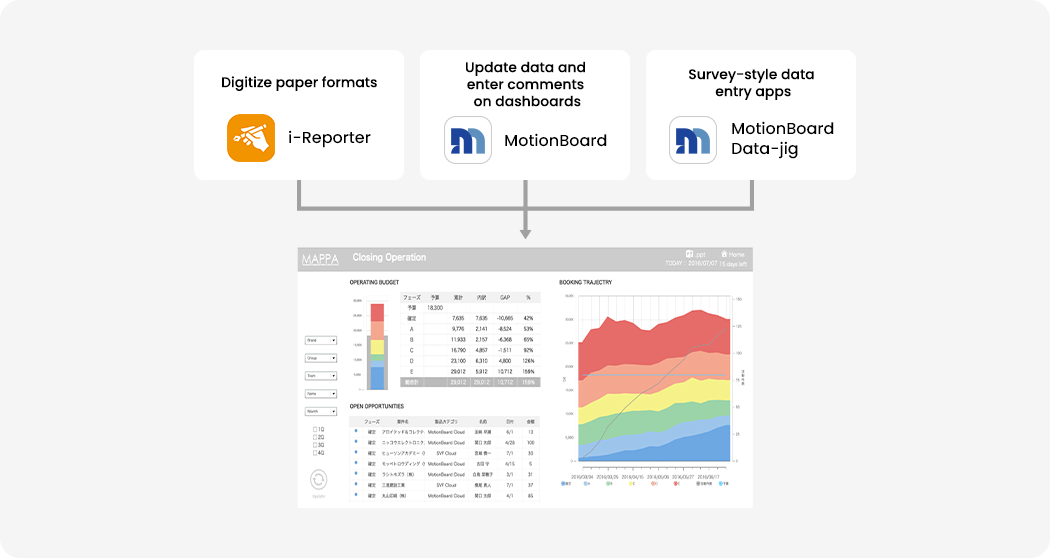
In addition, by choosing the right input method for your needs—such as i-Reporter (CIMTOPS Corp.)
for digitizing paper forms like daily reports, or "Data-Jig" for easy Q&A style surveys—you can leverage
operational data in a timely manner.
Three Flexible Input Methods
for Every Need
-
01

- Digitize paper-based daily reports and inspection sheets used in manufacturing or construction sites
- Instantly visualize digitized data to drive on-site improvements
- Design with high flexibility, including photo attachments and barcode scanning
Note: i-Reporter is an onsite reporting system provided by CIMTOPS Corporation.
Replace familiar paper forms with digital ones while keeping the same layout—and visualize data in real time with MotionBoard! -
02

- Update and modify visualized data directly on the dashboard
- Leave comments and notes right on the dashboard
- Update statuses for task tracking, workflows, and sales opportunity management
No need to modify original data sources—update data directly while viewing the dashboard! -
03
Data-Jig- Easily create simple input forms, such as for survey aggregation
- Build step-by-step forms to prevent missing entries.
- Set up a data entry environment without the need to implement new systems.
Start simply without complex design—
Available at no extra cost for existing MotionBoard users!
Feature 05
Data storage
(cloud only)
MotionBoard Cloud comes standard with built-in data storage for Excel and CSV files.
With these extensive functions available for as few as 10 users, MotionBoard Cloud
offers exceptional cost-performance.
Feature 06
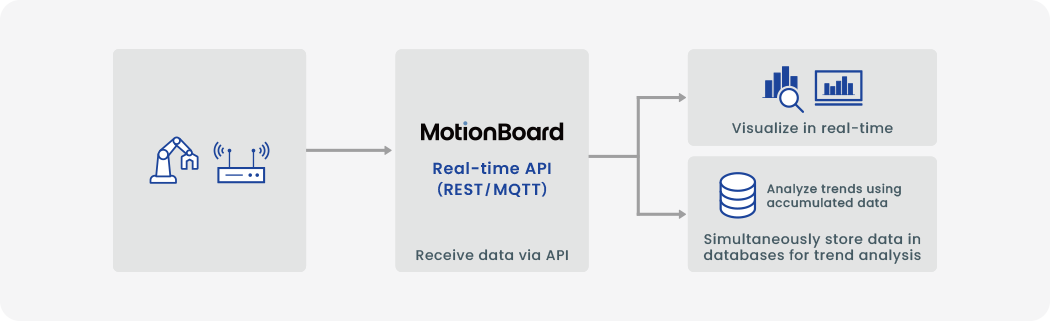
IoT data collection and utilization
We provide APIs for real-time integration with IoT data.
MotionBoard receives sensor data and visualizes it instantly.
Furthermore, it is also possible to write the received data to a database for further utilization.
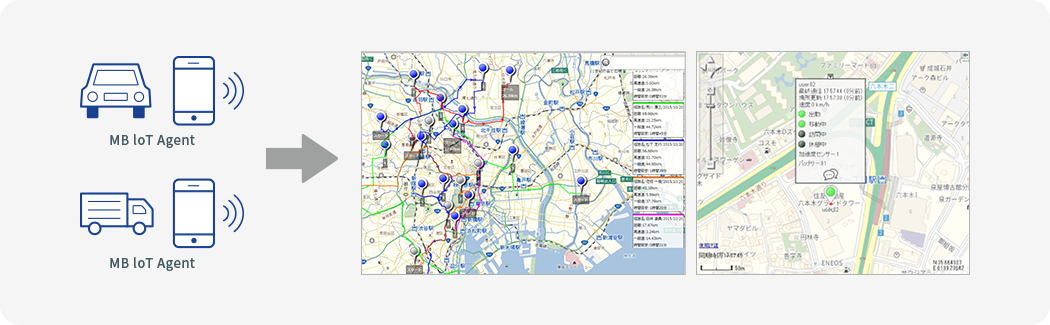
By using the MotionBoard IoT Agent smartphone app, you can obtain sensor information such as location data and any status information.
Demo
Try our sample dashboards now.
- Explore over 40 dashboards
- Dashboards by Industry
Manufacturing, logistics, finance, healthcare - Dashboards by Role
Accounting, HR, sales, sales management, marketing, IoT - Other feature-specific dashboards
