


About
No. 1 in Japan for
Market Share and Customer Satisfaction
The number one data platform in Japan: implemented at 4,100 companies and highly rated by our customers.
-
- Total customers
- 4,100+*1
-
- Customer satisfaction for four consecutive years
- No.1 *2
-
- Top-rated support quality
- ★★★ *3
*1: Cumulative number of customers for cloud and on-premises versions (as of the end of February 2026)
*2: Ranked No. 1 in the "Data Analysis & Utilization Platform Software/Services" category of the Nikkei Computer - Customer Satisfaction Survey 2025-2026 (September 4, 2025 issue)
*3: Awarded the highest "Three-Star" rating in the "Quality Rating" benchmark conducted by HDI-Japan
Features
Feature 01
Automatically create dashboards and items with Generative AI
With the generative AI Widget, you can automatically create dashboards and individual items through a chat interface. Once saved, these can be viewed and utilized, just like standard dashboards. Additionally, you can make changes to charts and perform insight analysis using natural language.
Feature 02
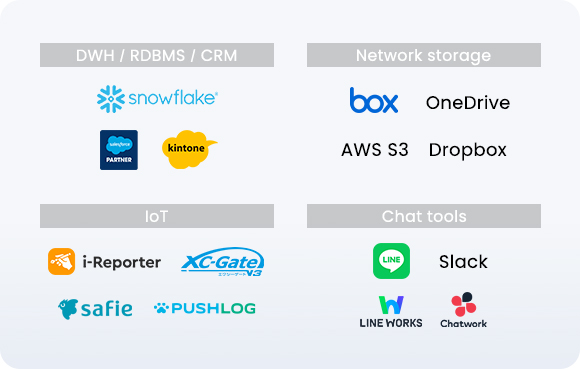
Connect to any data source to visualize and share data in real time
You can connect to over 60 types of data source. Collect not only system data, but also on-site data, and combine sources for rich visualization and analysis.
Feature 03
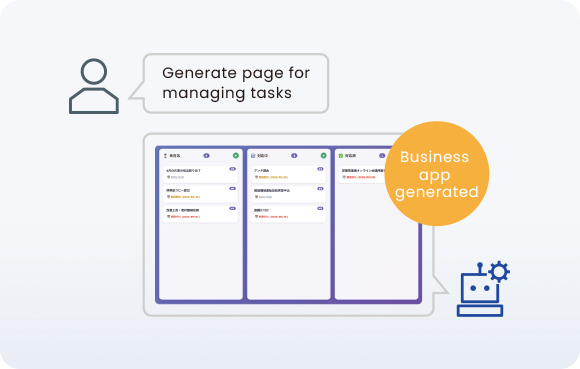
Easily build business-ready apps
Use data input and button action functions to create business applications. And with the new AI widget you can easily create apps through a simple chat interface.
Feature 04
Flow features make logic design simpler than ever
You can easily implement operational logic in your dashboards and apps by combining simple building blocks and without excessive learning costs.
Accelerate your data empowerment
with MotionBoard
Function MotionBoard Functions
-

Report output
-
Action flow
-

Connect Camera
-

Generative AI integration
-

Data entry
-

Alert notifications
-

Chat tool integration
-

IoT data integration
Reason
Why Choose
MotionBoard
-

No.1 in customer satisfaction for support quality
In addition to product implementation, we offer various services and content to ensure that utilization becomes established.
-

Flexibility and scalability to drive in-house development
By using it in conjunction with the data analysis platform Dr.Sum, large amounts of data from disparate data sources can be aggregated quickly, enhancing visualization and analysis performance.
-

Flexible pricing and delivery options to fit your needs
You can select on-premises products or cloud services. Additionally, you can use at a fixed cost regardless of the amount of data, preventing unexpected expenses.
