Sort
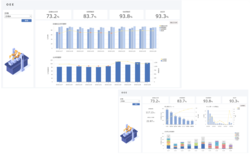
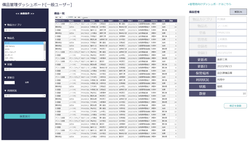

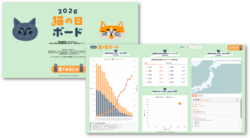
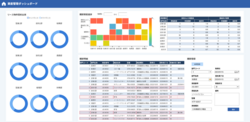
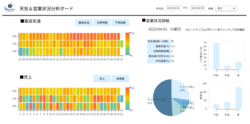
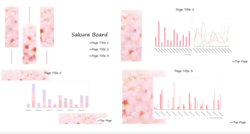
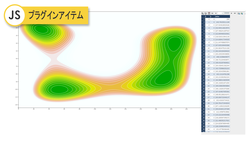
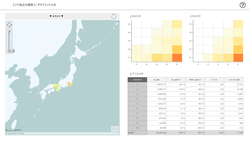
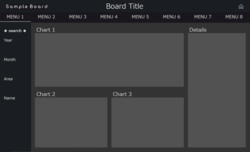
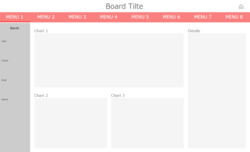
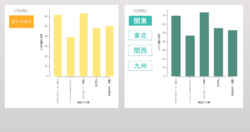
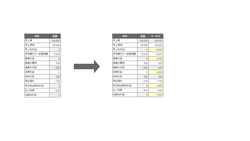
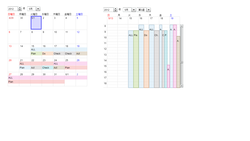
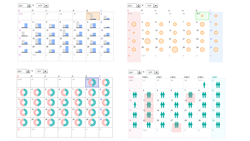
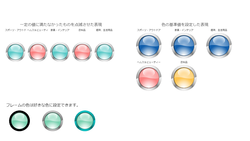
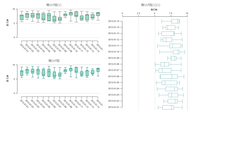
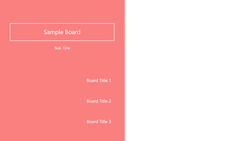
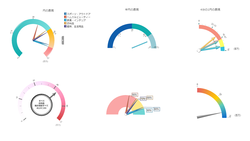
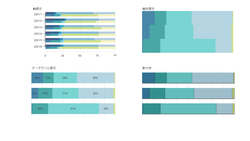
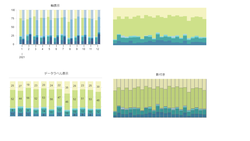
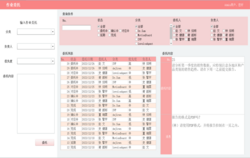
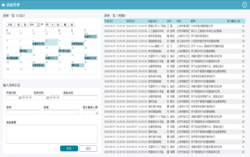
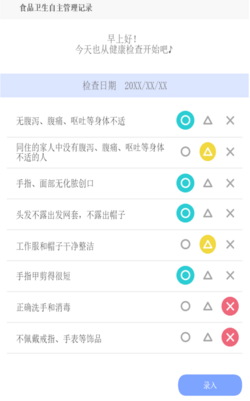
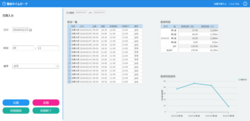
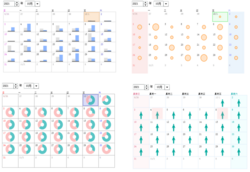
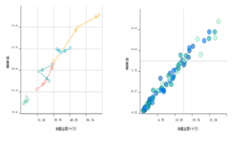
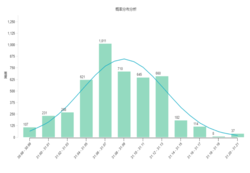
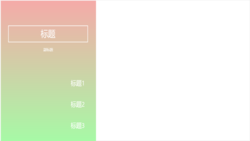
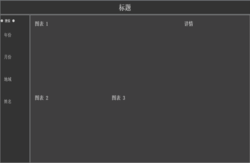
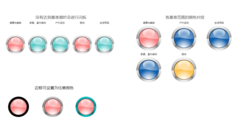
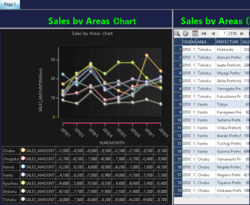
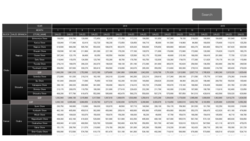
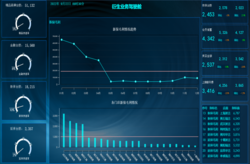
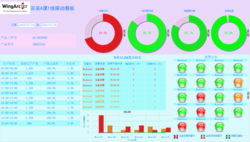
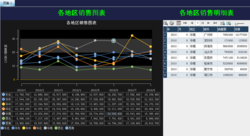
さくらボード
春の季節にぴったりなさくらの模様のデザインテンプレートです。グラフにはさくらカラーのカラーセットも入っているので、ぜひご活用ください。
- Japanese
- Update:23/12/2025
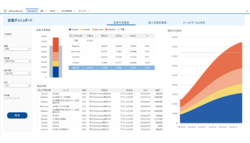
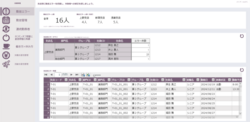

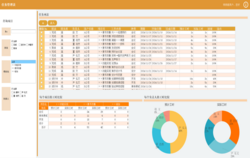

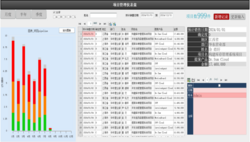
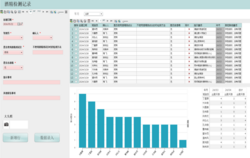
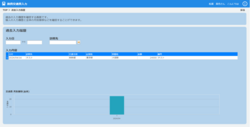
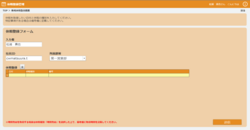
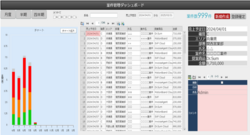
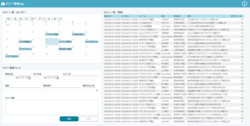
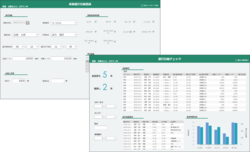
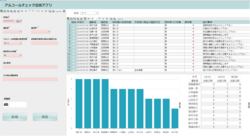
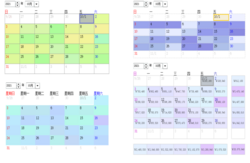
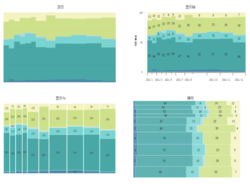
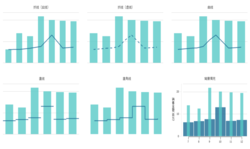
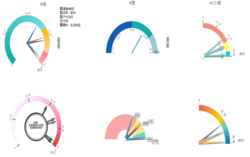
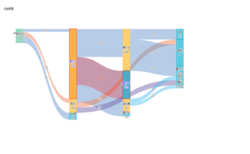
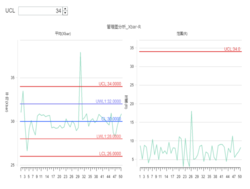

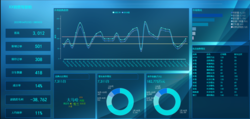
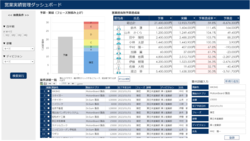
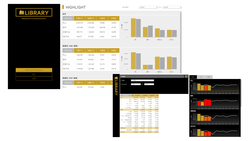
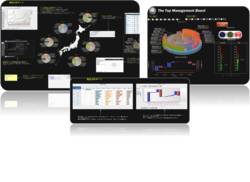
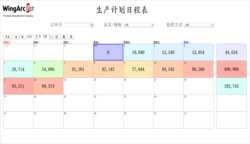
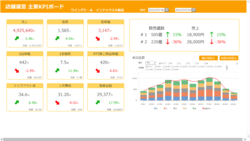
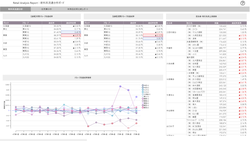
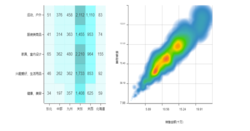
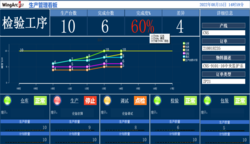
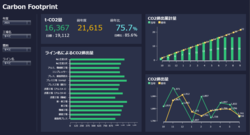
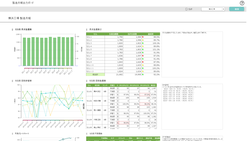
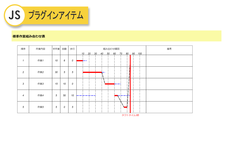
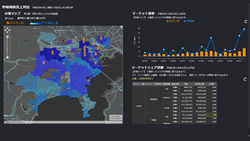
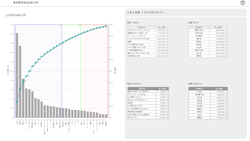
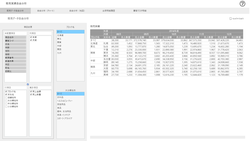
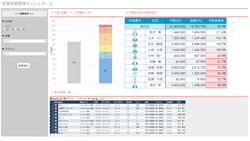
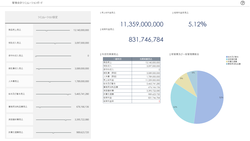
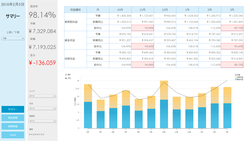
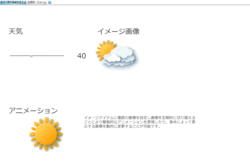
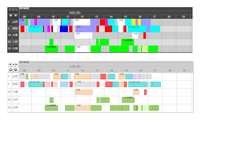
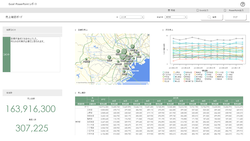
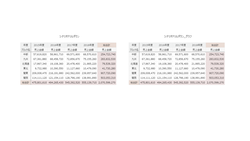
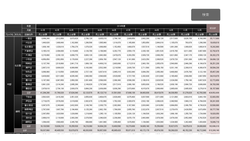
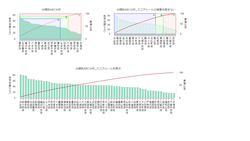
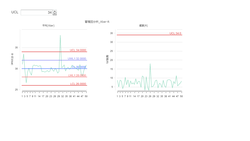
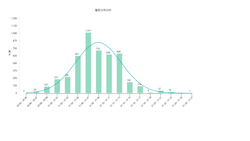
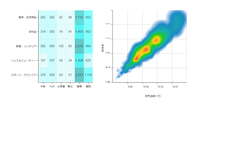
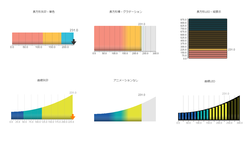
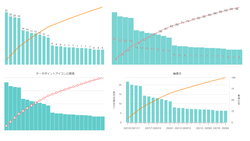
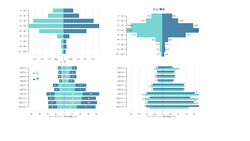
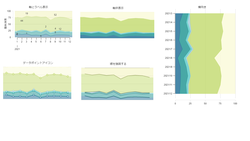
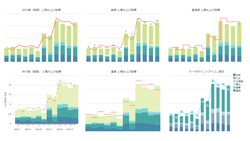
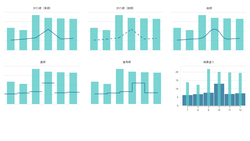
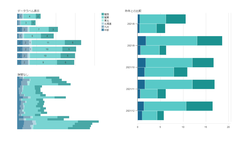
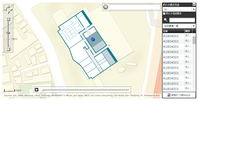
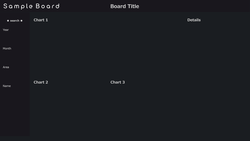
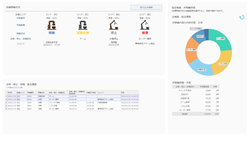
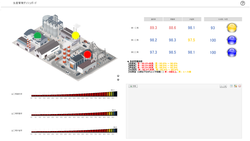
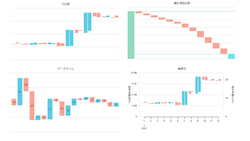
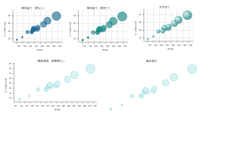
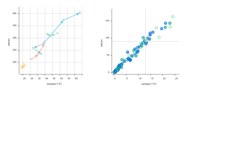
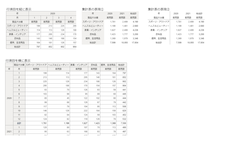
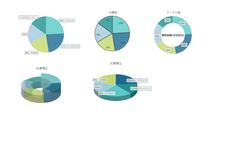
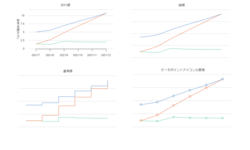
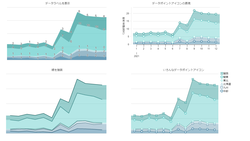
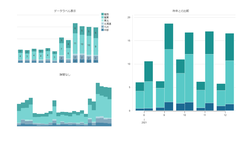
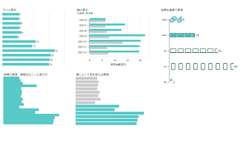
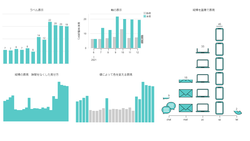
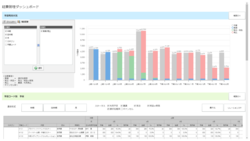
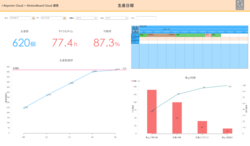
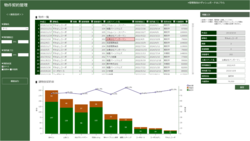
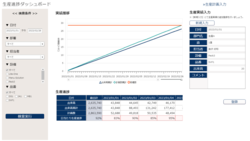
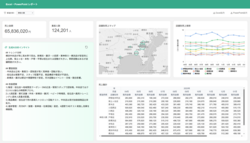
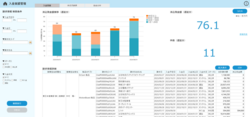
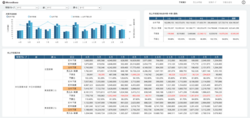
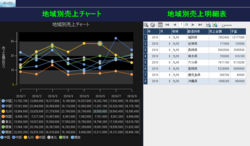
製造月報出力ダッシュボード
工場ごとの生産指標を見える化し、コメントなどを追加して月報として出力できるダッシュボードです。
- Manufacturing
- Japanese
- Update:23/12/2025
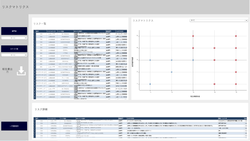
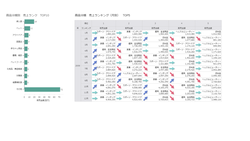
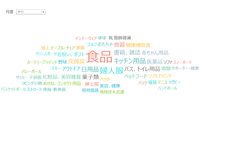
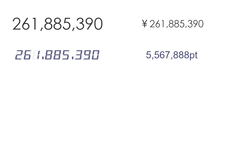
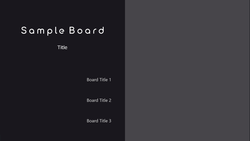
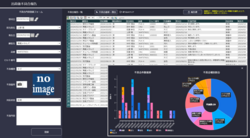
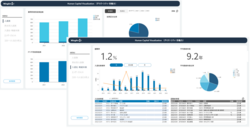
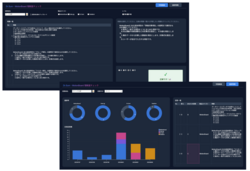
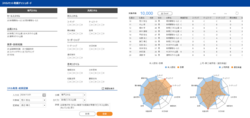
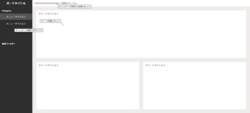
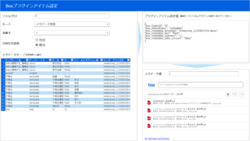
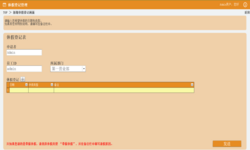
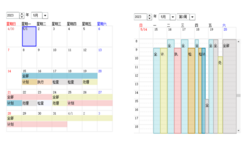
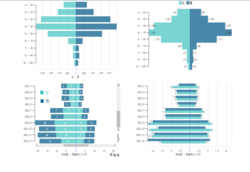
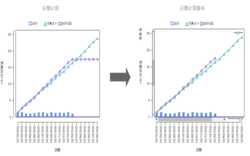
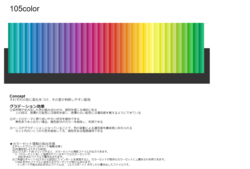
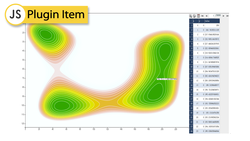
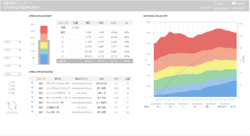
文字スクロール
複数の文字を画面上に流動的に表示するチャートです。テキストの移動速度や表示位置、文字の色などデザインに関するカスタマイズも可能です。
- Japanese
- Update:23/12/2025