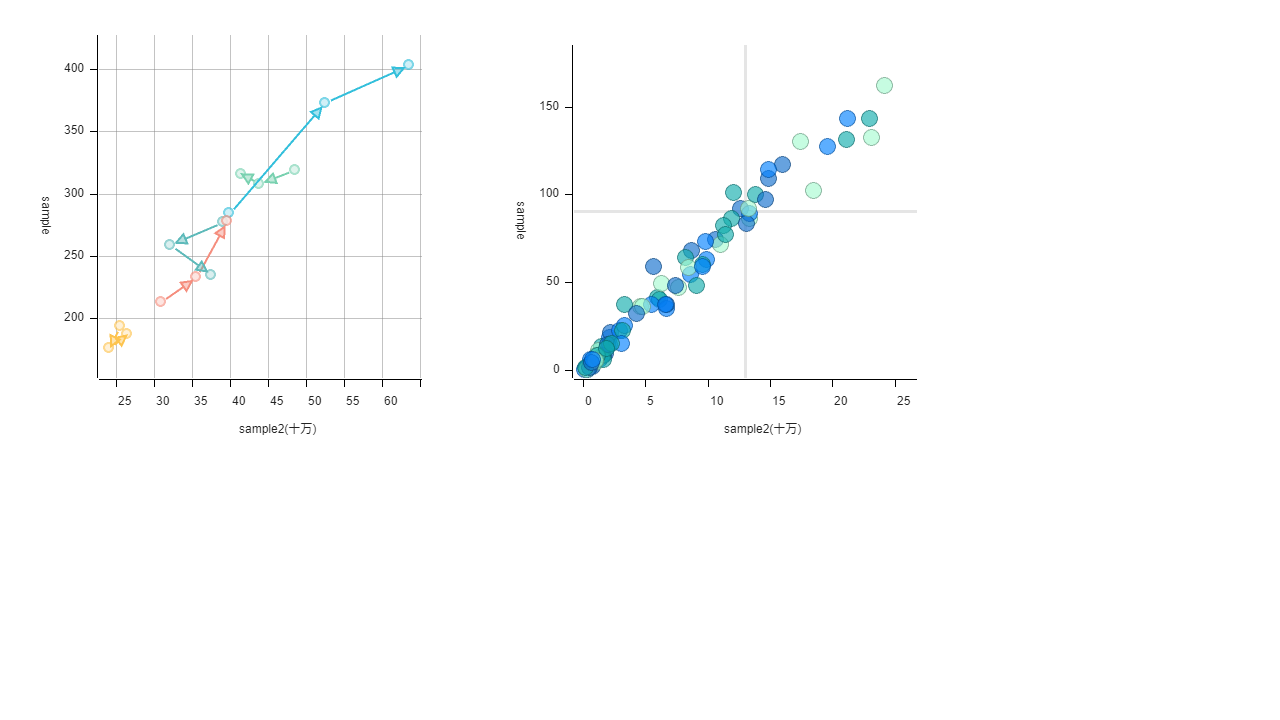
散布図
2つのデータ間に関係性があるかを分析する際に使う表現です。
サンプルでは購入数量と購入金額の推移を月ごとにプロットした散布図です。
Target products:MotionBoard、MotionBoard Cloud
Version:6.0以降のバージョンでご利用いただけます。また、最新パッチでのご利用を前提としております。
Samples for customers currently using our products
Download file
Applicable language for samples: Japanese
Posted:11/03/2022
Updated:22/12/2025
*You can operate the samples in the MotionBoard Demo Site prepared by WingArc1st Inc.
Please note that there are some differences with the posted content.