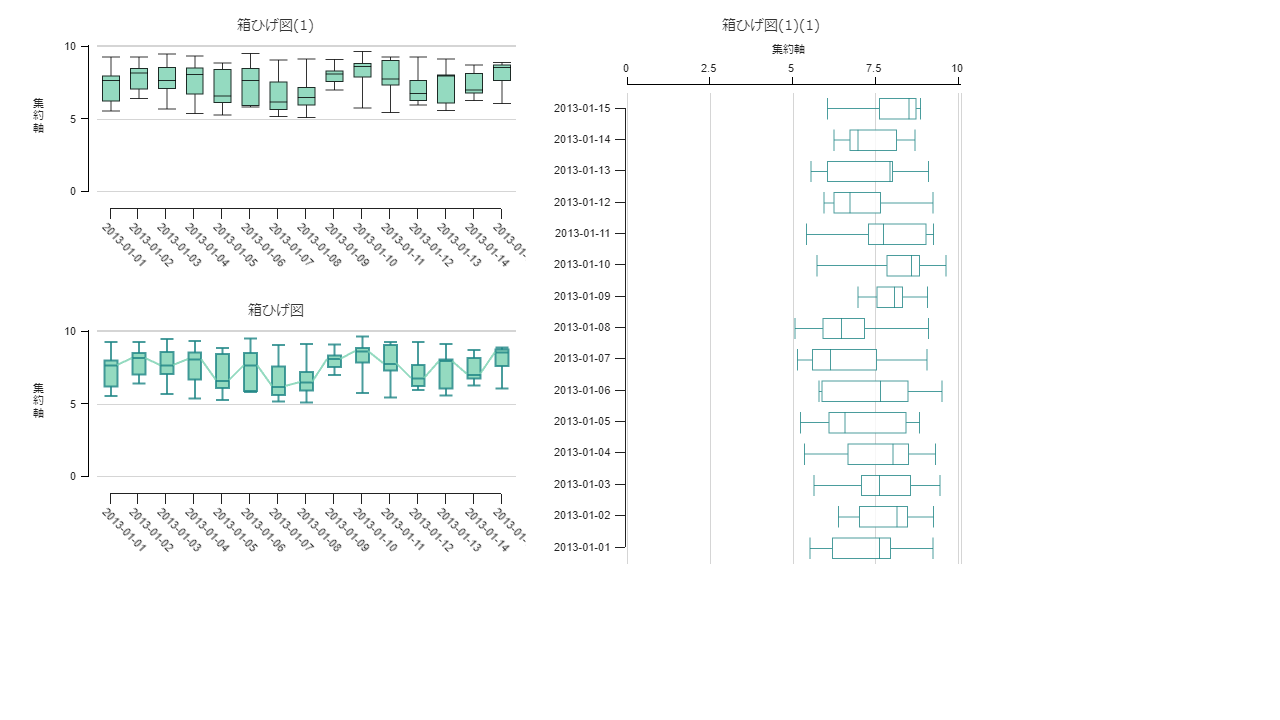
箱ひげ図
箱ひげ図はデータのばらつき具合を分かりやすく表現するチャートです。
サンプルでは指標の日ごとの推移を表しており、箱の部分でデータのばらつき具合、両端の髭の部分で最大値、最小値を表現しています。
Target products:MotionBoard、MotionBoard Cloud
Version:6.0以降のバージョンでご利用いただけます。また、最新パッチでのご利用を前提としております。
Samples for customers currently using our products
Download file
Applicable language for samples: Japanese
Posted:16/03/2022
Updated:22/12/2025
*You can operate the samples in the MotionBoard Demo Site prepared by WingArc1st Inc.
Please note that there are some differences with the posted content.