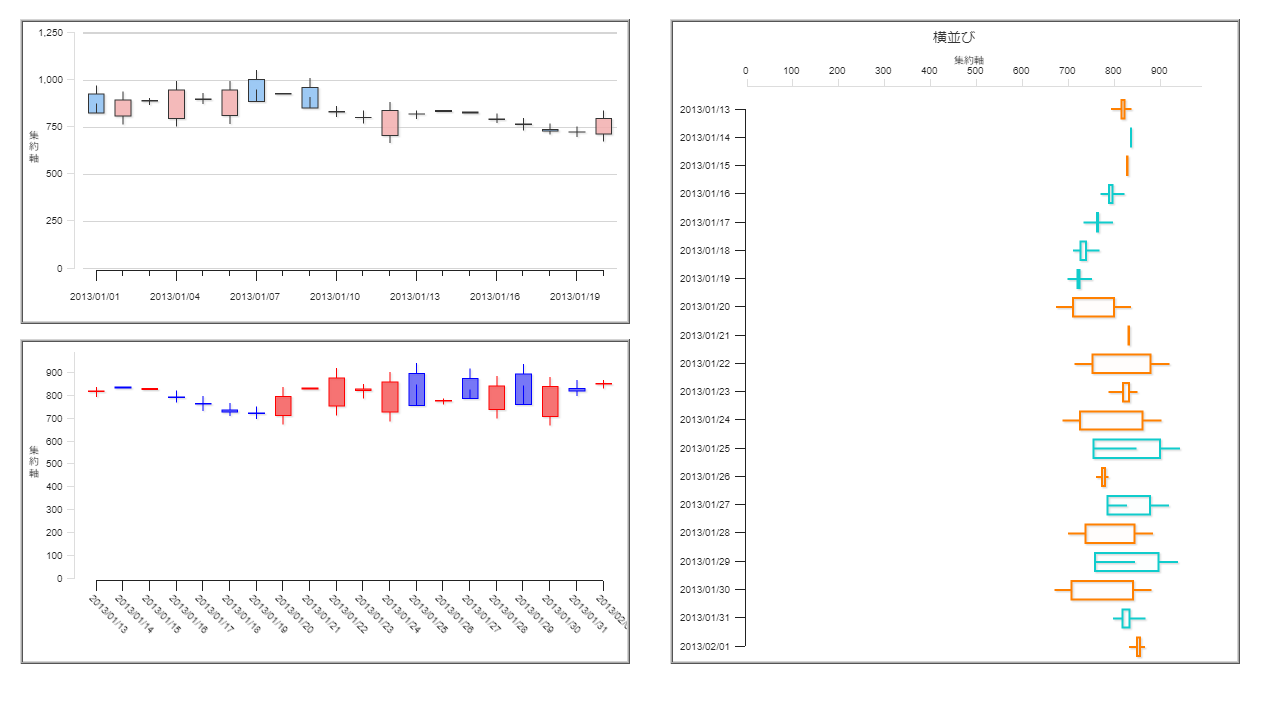
ローソク足
ローソク足は株価の値動きを時系列に沿って表現するチャートです。
相場の4本値(始値、高値、安値、終値)を用いて一本の棒状の足を生成することで値動きを分析できるチャートです。
サンプルのようにカラーやデザインを変更することもできます。
Target products:MotionBoard、MotionBoard Cloud
Version:6.0以降のバージョンでご利用いただけます。また、最新パッチでのご利用を前提としております。
Samples for customers currently using our products
Download file
Applicable language for samples: Japanese
Posted:16/03/2022
Updated:22/12/2025
*You can operate the samples in the MotionBoard Demo Site prepared by WingArc1st Inc.
Please note that there are some differences with the posted content.