ヒートマップ
データに「濃淡」を付けることで、データ全体の分布と密度を表現できるチャートです。
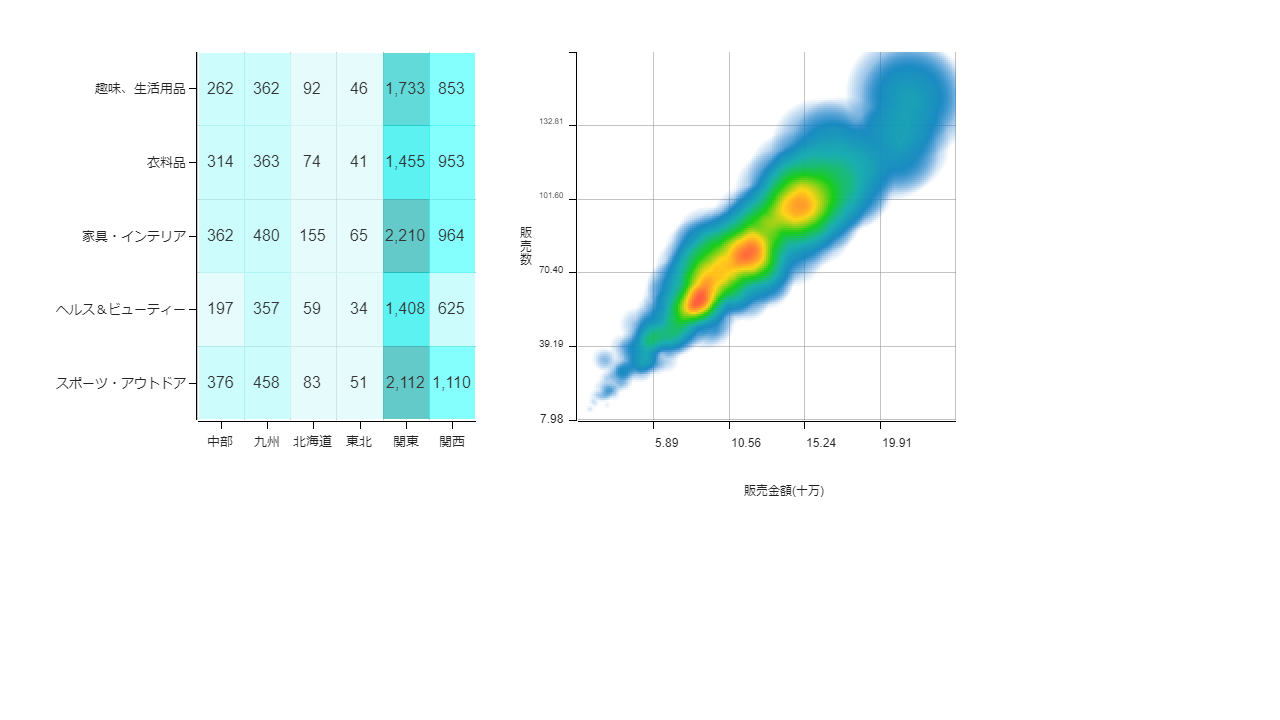
サンプルにある数値軸ヒートマップと行列軸ヒートマップの2種類が用意されています。
表示形式はダイナミックチェンジアイコンで簡単に切り替えることもできます。
Target products:MotionBoard、MotionBoard Cloud
Version:6.0以降のバージョンでご利用いただけます。また、最新パッチでのご利用を前提としております。
Samples for customers currently using our products
Download file
Applicable language for samples: Japanese
Posted:16/03/2022
Updated:22/12/2025
*You can operate the samples in the MotionBoard Demo Site prepared by WingArc1st Inc.
Please note that there are some differences with the posted content.