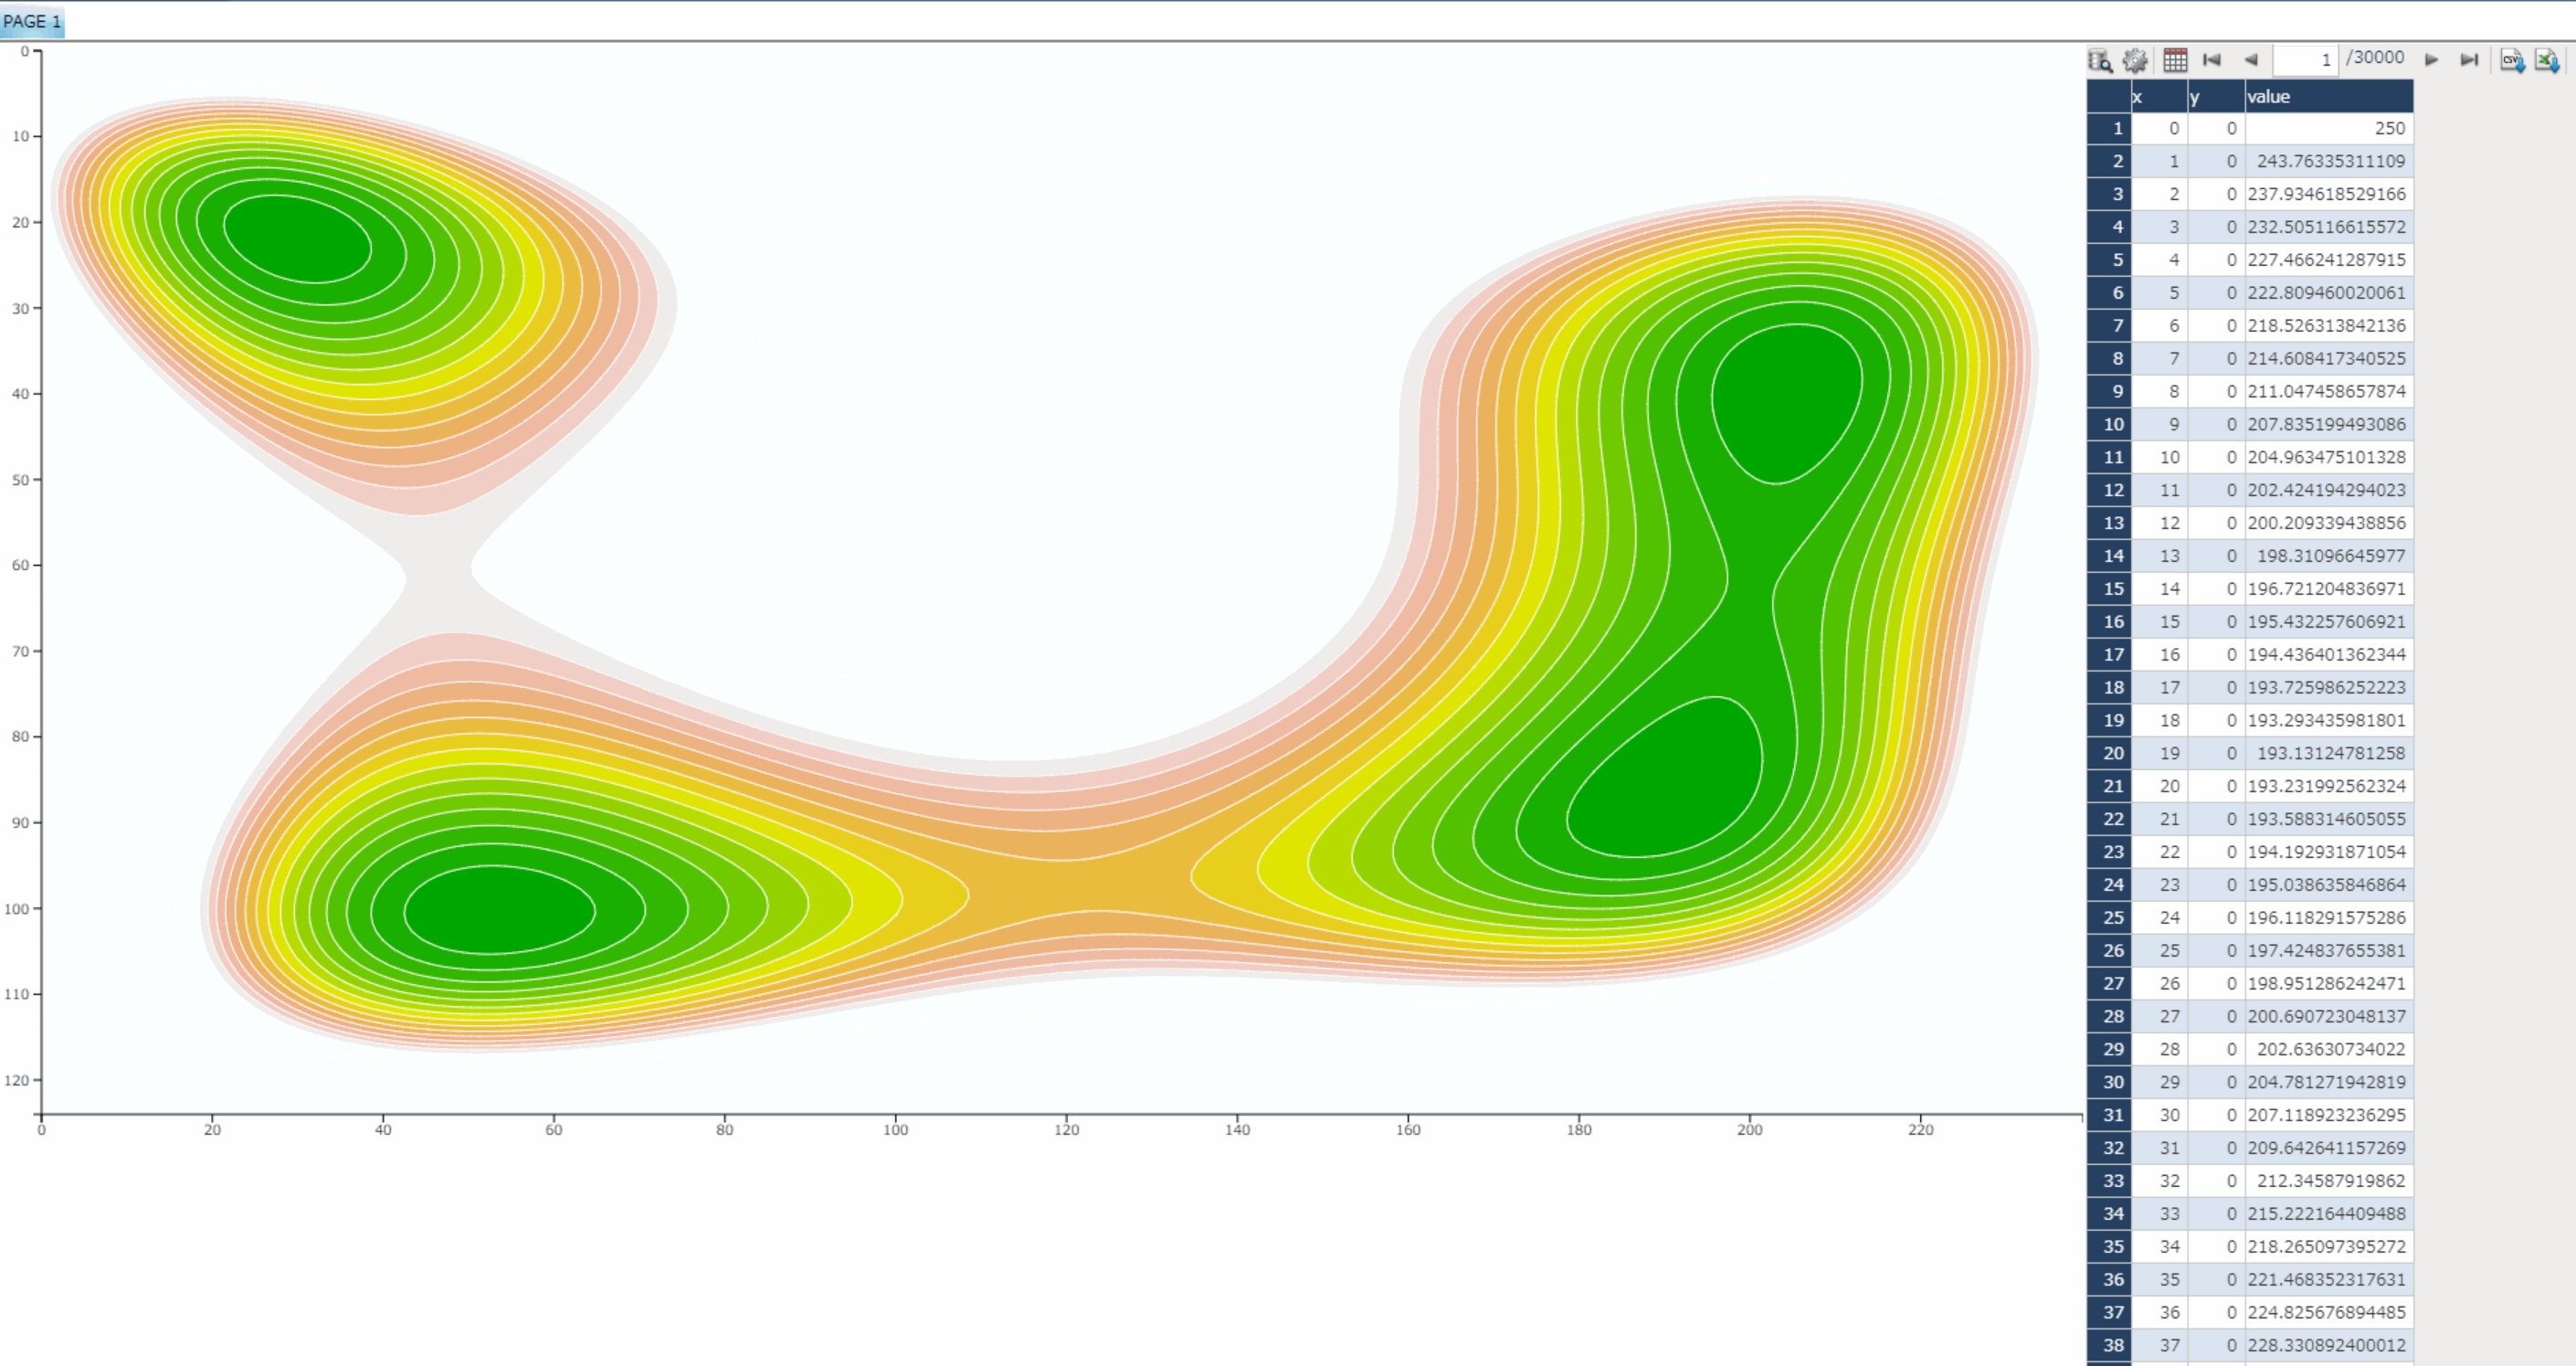
Contour map
This chart displays contour maps. Given two-dimensional coordinates and data on the values corresponding to each point, different values can be expressed in different colors.
In the sample script, the number of color divisions can be increased for a more detailed look at value changes, or values below a certain level can be omitted, allowing each user to choose his or her own expression method. Not only geographical expressions such as contour maps, but also physical indicators such as temperature and pressure distribution can be visualized.
*For those who download the sample
This sample requires a plug-in item. You cannot the sample in MotionBoard Cloud.
The plug-in items provided in the Sample Gallery are not subject to ISMAP and SOC1 information security certifications. Please refer to the following page for information security certifications obtained for MotionBoard Cloud.
https://corp.wingarc.com/security_governance/certification.html
Target products:MotionBoard
Version:Ver. 6.2 or later. The latest patch must be applied.
Samples for customers currently using our products
Applicable language for samples: English
Posted:14/09/2023
Updated:23/12/2025