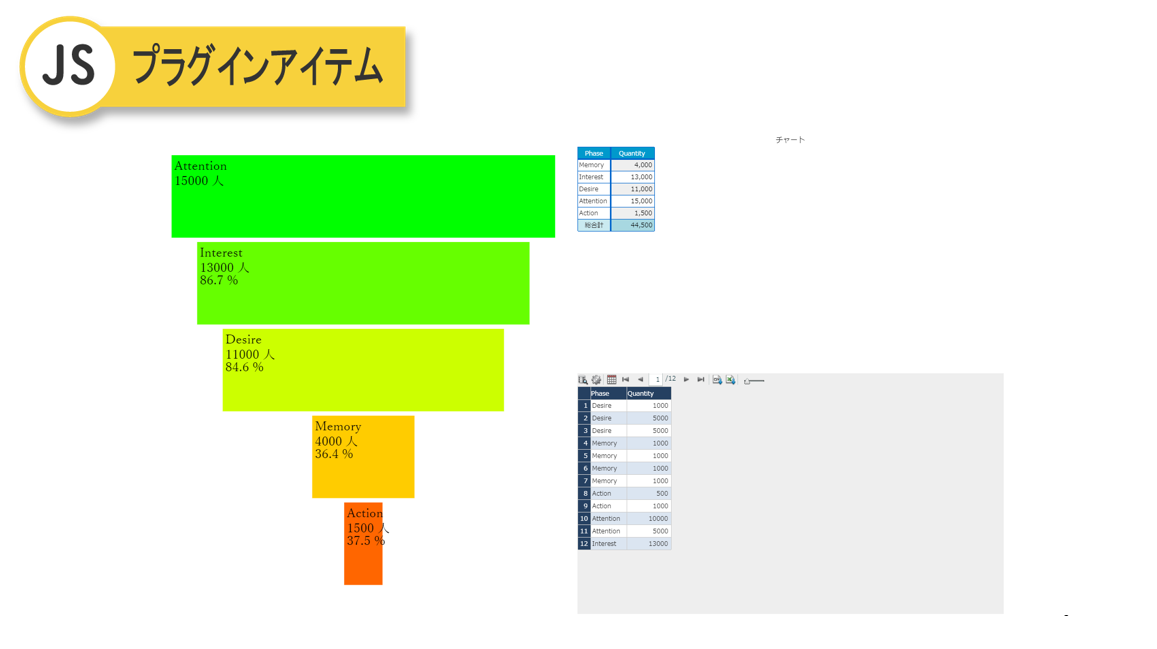
じょうご図
購買プロセスと各プロセスの流量を可視化できるマーケティングファネルチャートです。
プロセス名と対応する流量のデータがあれば、各プロセスにおける流量及び割合を可視化できます。
チャート全体のカラーリングを変更したり、流量の単位を"人"や"円"等にカスタマイズ可能です。
リード獲得やナーチャリングなどの各フェーズにおける人口の流量を見る際にご利用できます。
*For those who download the sample
本サンプルは、プラグインアイテムを利用しています。
MotionBoard Cloudではご利用いただけませんので、ご注意ください。
プラグインアイテムは、情報セキュリティ認証であるISMAPやSOC1の対象外です。
MotionBoard Cloudが取得している情報セキュリティ認証に関しては、
https://corp.wingarc.com/security_governance/certification.html
を参照してください。
Target products:MotionBoard
Version:6.2以降のバージョンでご利用いただけます。また、最新パッチでのご利用を前提としております。
Samples for customers currently using our products
Applicable language for samples: Japanese
Posted:18/03/2022
Updated:23/12/2025
*You can operate the samples in the MotionBoard Demo Site prepared by WingArc1st Inc.
Please note that there are some differences with the posted content.