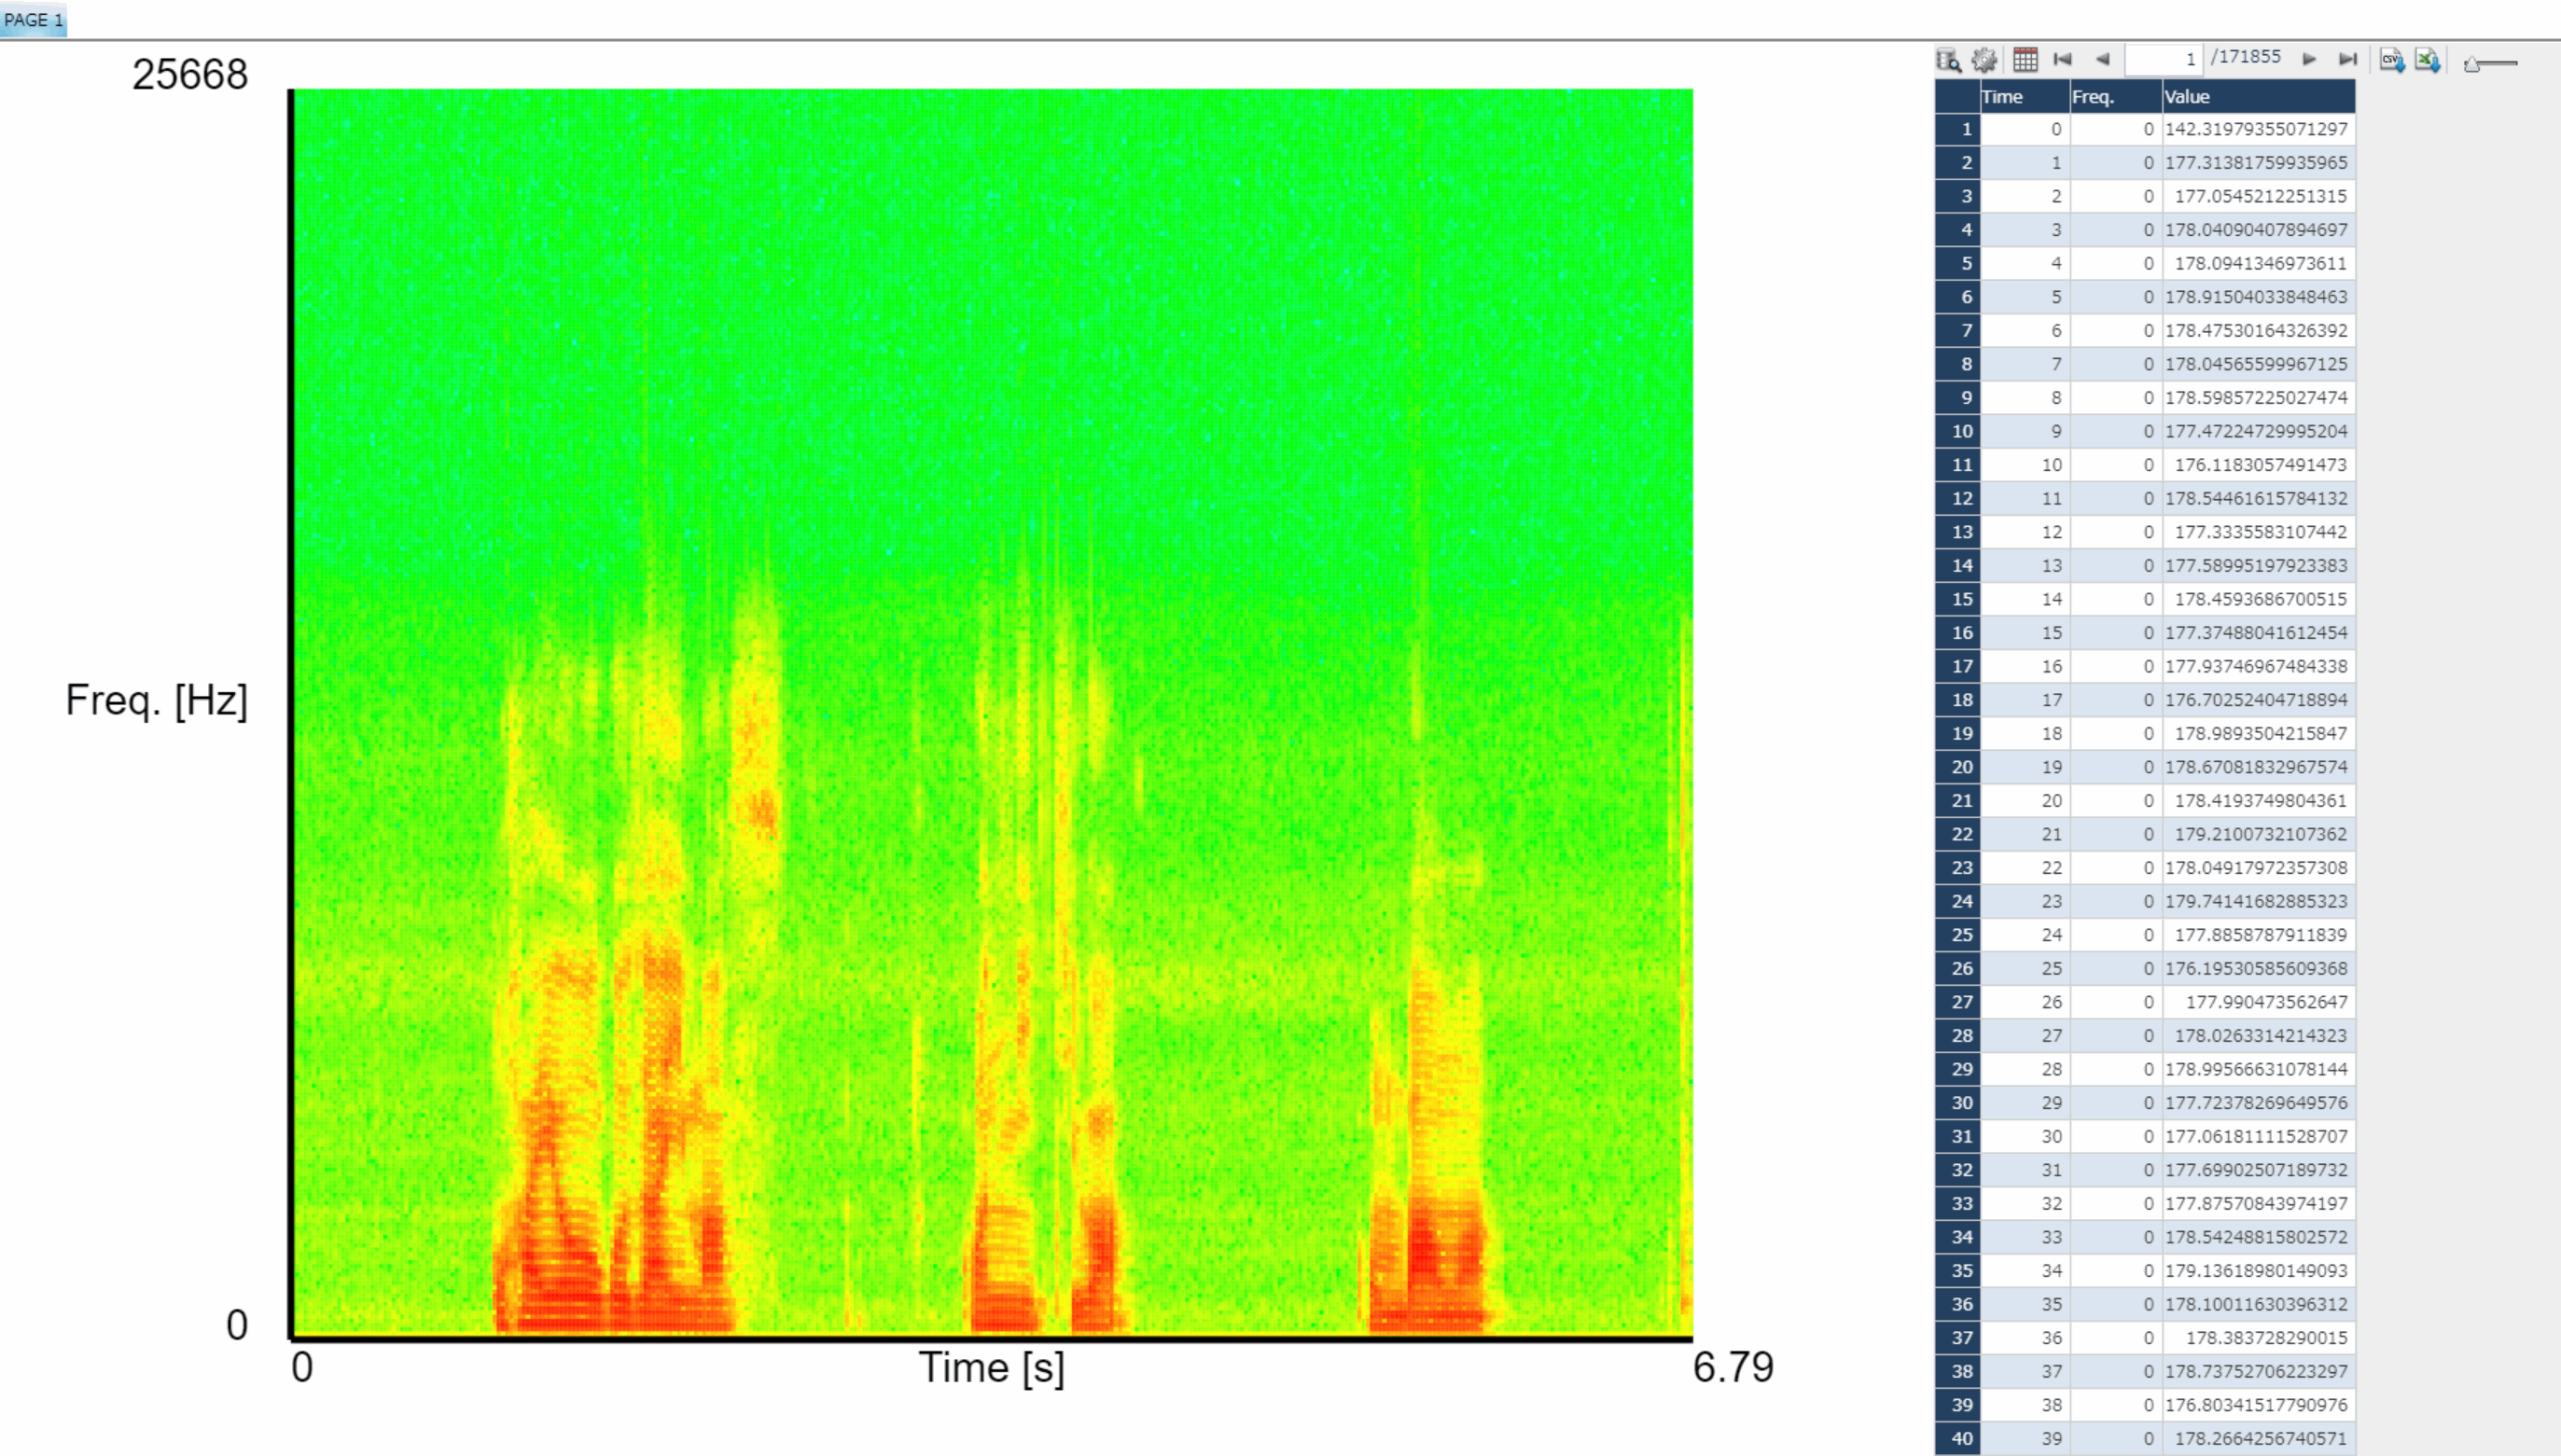
FFT Spectrogram
This chart visualizes audio data that analyzes time and frequency. Given two-dimensional coordinates representing time and frequency and data on the values corresponding to each point, you can display the intensity of each point.
Given the parameters of the time-frequency analysis, you can calculate the playback time.
This sample can be used to visualize data with a large number of points, such as image data or the results of time-frequency analysis.
※サンプルをダウンロードする方へ
This sample requires a plug-in item. You cannot the sample in MotionBoard Cloud.
The plug-in items provided in the Sample Gallery are not subject to ISMAP and SOC1 information security certifications. Please refer to the following page for information security certifications obtained for MotionBoard Cloud.
https://corp.wingarc.com/security_governance/certification.html
対象製品:MotionBoard
バージョン:Ver. 6.2 or later. The latest patch must be applied.
MotionBoard をご利用中の方向け サンプル
掲載日:2023/09/14
更新日:2025/12/23

